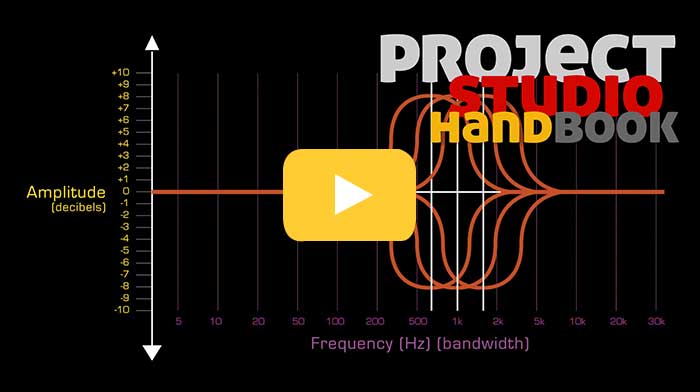
EQ diagrams are similar to the frequency response diagram. They use a simple line to plot the shape and amount of cut or boost to a range of harmonics or frequencies. Because EQ devices usually contain multiple filters of differing types for bass, mid range and treble, it is common for each filter's actions to be represented by an individual diagram in the EQ device's manual.
Now, click to watch our video at our sister site ..