 MP3 sample waves
If you have not done so already, you may wish to read what is sound? first.
NOTE: The diagrams on this page show the waveform of a sine wave.
Now, click to watch our video at our sister site (or read on) ..

Sine wave
When a source expands and contracts absolutely consistently (unfound in nature) it is said to be moving in simple harmonic motion. The wave it produces is known as a sine wave.
The diagrams on this page show a sine wave. We could have used any other wave but a sine wave is nice and simple and makes it easier to show how waveform diagrams work. You can listen to sine waves at different frequencies by clicking on the MP3 audio examples on this page.
NOTE: A single isolated sine wave can only be created by an electronic sound source (an oscillator) which can create and electrical pressure soundwave according to the strict mathematical principals of electronics design. Sine waves are the building blocks of all complex sounds found in nature.
Waveform diagrams of a sine wave
1) Cycle of source (a sphere) vibration - compression and rarefaction
2) Waveform diagram- amplitude, wavelength (frequency), compression and rarefaction
Amplitude
The "amount" of compression and rarefaction of the air is the amplitude of the soundwave, the volume or loudness which the ear perceives. As long as the air pressure is changing (rising and falling), sound will be heard.
It is critical to note that waveform diagrams show amplitude on a bi-polar axis, and that silence is shown as a flat horizontal line (the horizontal axis).
A soundwave of a single
frequency shown at 2
amplitudes, and silence.
Cycles
When a source has expanded and contracted once it is said to have cycled. This is a single vibration.
Wavelength
The physical distance between two adjacent points on a sound wave (from any point on one cycle to the same point on the following cycle) is known as the wavelength and is denoted by the Greek letter lambda. Because a sound source can vibrate at many different speeds this wavelength is variable.
The wavelength of sound at 20 cycles per second (deep bass) is approximately 17 metres. The wavelength of sound at 20,000 cycles per seconds (high treble) is 1.7 cm. Wavelength is critical to understanding of how sound behaves when it encounters a physical obstruction. (See transmission, reflection and absorption later).
Frequency
The speed at which the source vibrates is known as the frequency of the soundwave and is expressed in hertz (Hz) or cycles per second (cps). 1000 hertz = 1 kilohertz (kHz).

Humans can hear frequencies between 20Hz and 20KHz. This is known as the audio spectrum.
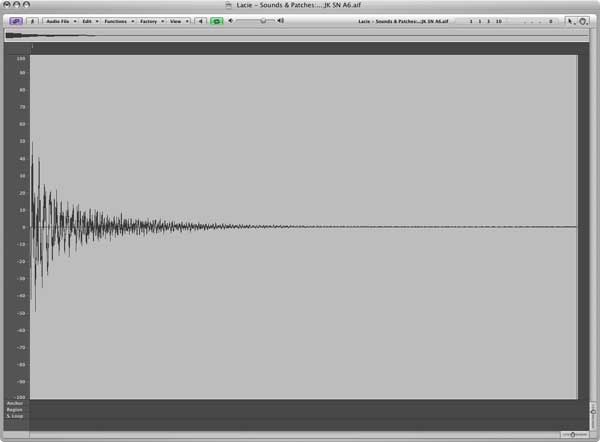
Waveform diagrams employed by audio software
Waveform digrams are the standard way to visualise soundwaves in audio software.
Read about complex waveforms next.
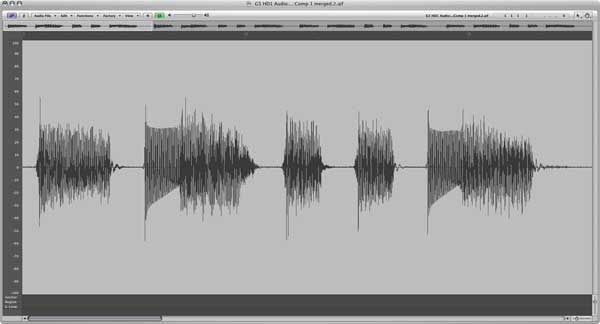
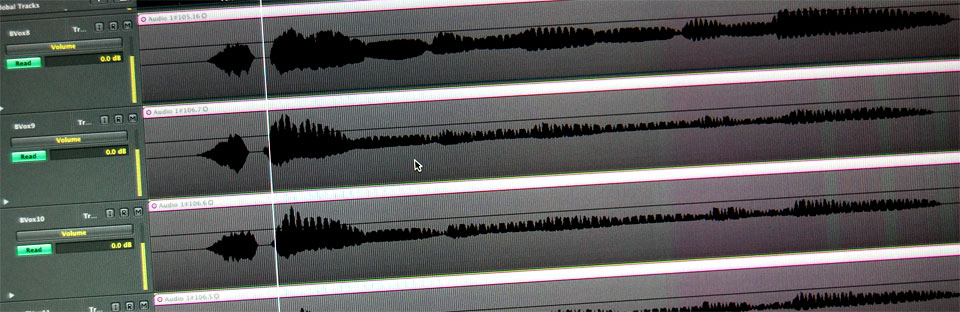
Screenshots from a the Logic sample editor window
1) A single snare hit
2) A vocal recording (1 bar)